畜牧与饲料科学 ›› 2023, Vol. 44 ›› Issue (2): 1-8.doi: 10.12160/j.issn.1672-5190.2023.02.001

• 科技创新支撑畜牧业高质量发展专栏——畜禽粪污无害化处理及资源化利用专题 •    下一篇

黑龙江省畜牧业粪污的时空分布及集聚特征分析

董依博1,张武鑫1,林秀蔚2,韦春波1   

  1. 1.黑龙江八一农垦大学动物科技学院/农业农村部东北平原农业绿色低碳重点实验室,黑龙江 大庆 163319
    2.黑龙江省农业科学院畜牧兽医分院,黑龙江 齐齐哈尔 161000
  • 收稿日期:2023-02-09 出版日期:2023-03-30 发布日期:2023-05-10
  • 通讯作者: 韦春波(1977—),男,副教授,硕士,硕士生导师,主要研究方向为畜牧生产管理与动物福利。
  • 作者简介:董依博(2001—),女,所学专业为动物科学。
  • 基金资助:
    黑龙江省大学生创新创业训练计划项目(S202210223008X)

Temporal and Spatial Distribution and Aggregation Characteristics of Livestock and Poultry Manures in Heilongjiang Province

DONG Yibo1,ZHANG Wuxin1,LIN Xiuwei2,WEI Chunbo1   

  1. 1. College of Animal Science and Technology,Heilongjiang Bayi Agricultural University/Key Laboratory of Low-carbon Green Agriculture in Northeastern China,Ministry of Agriculture and Rural Affairs,Daqing 163319,China
    2. Branch of Animal Husbandry and Veterinary,Heilongjiang Academy of Agricultural Sciences,Qiqihar 161000,China
  • Received:2023-02-09 Online:2023-03-30 Published:2023-05-10

摘要:

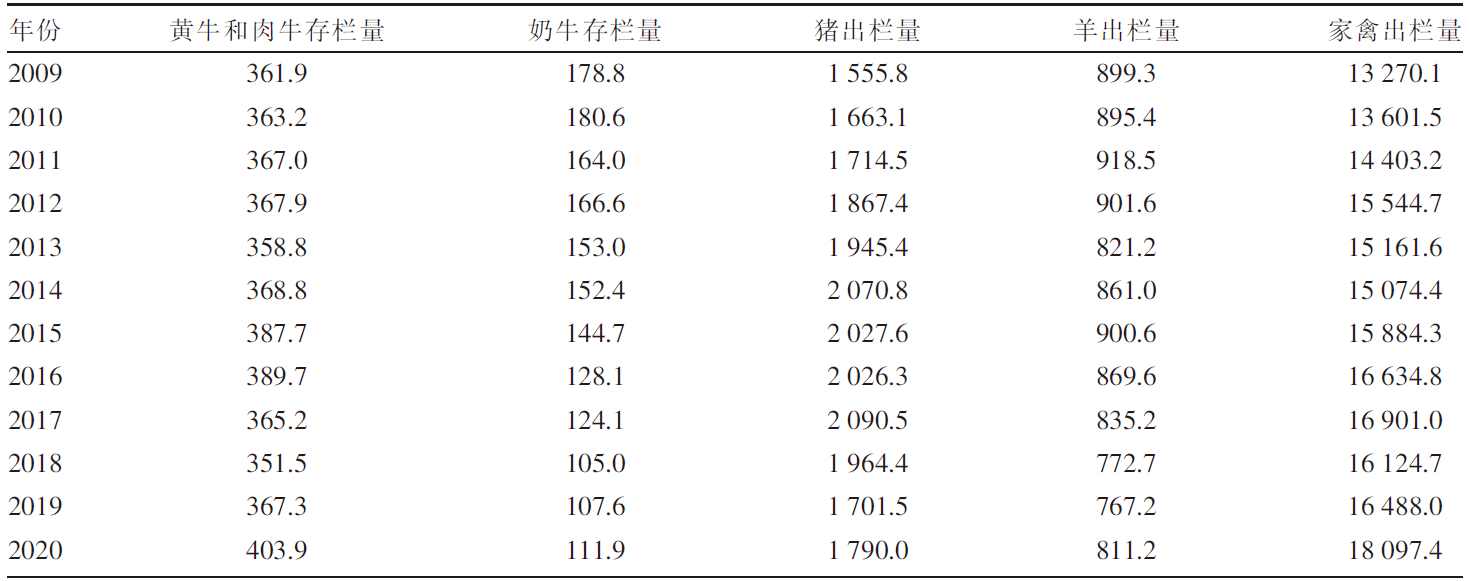
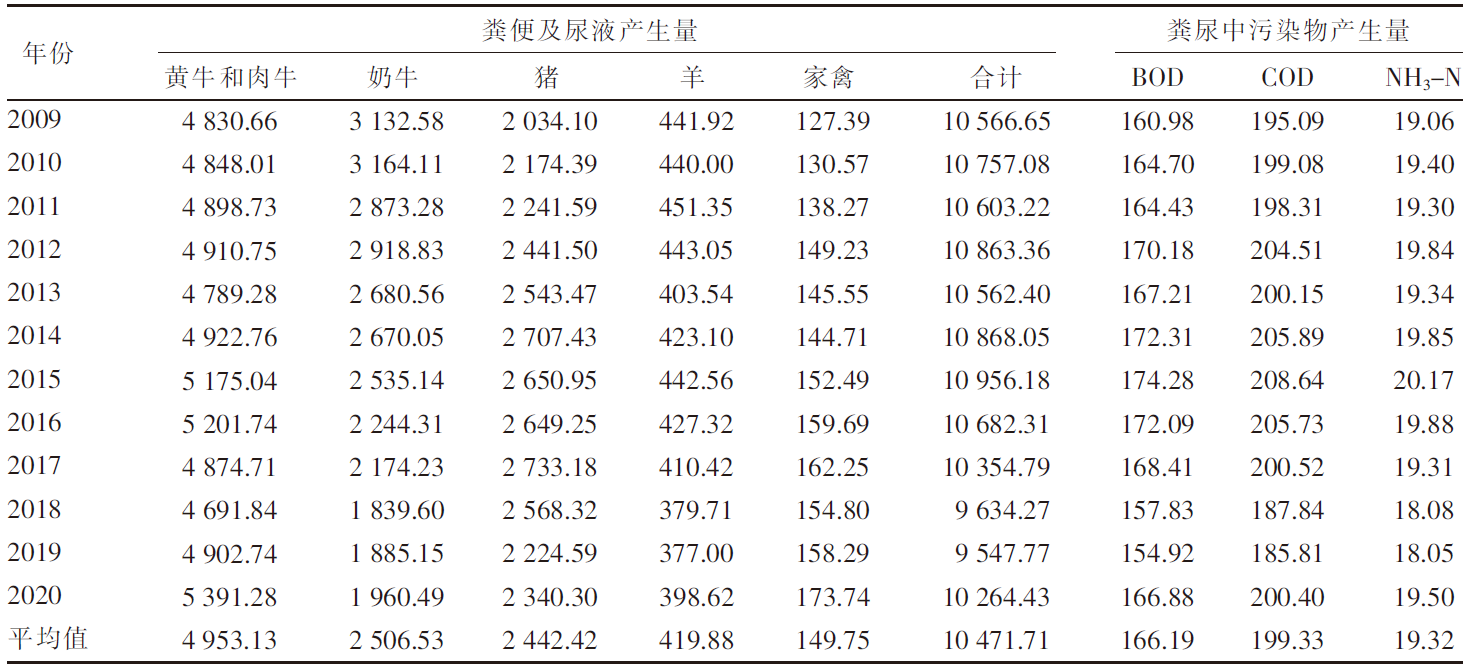
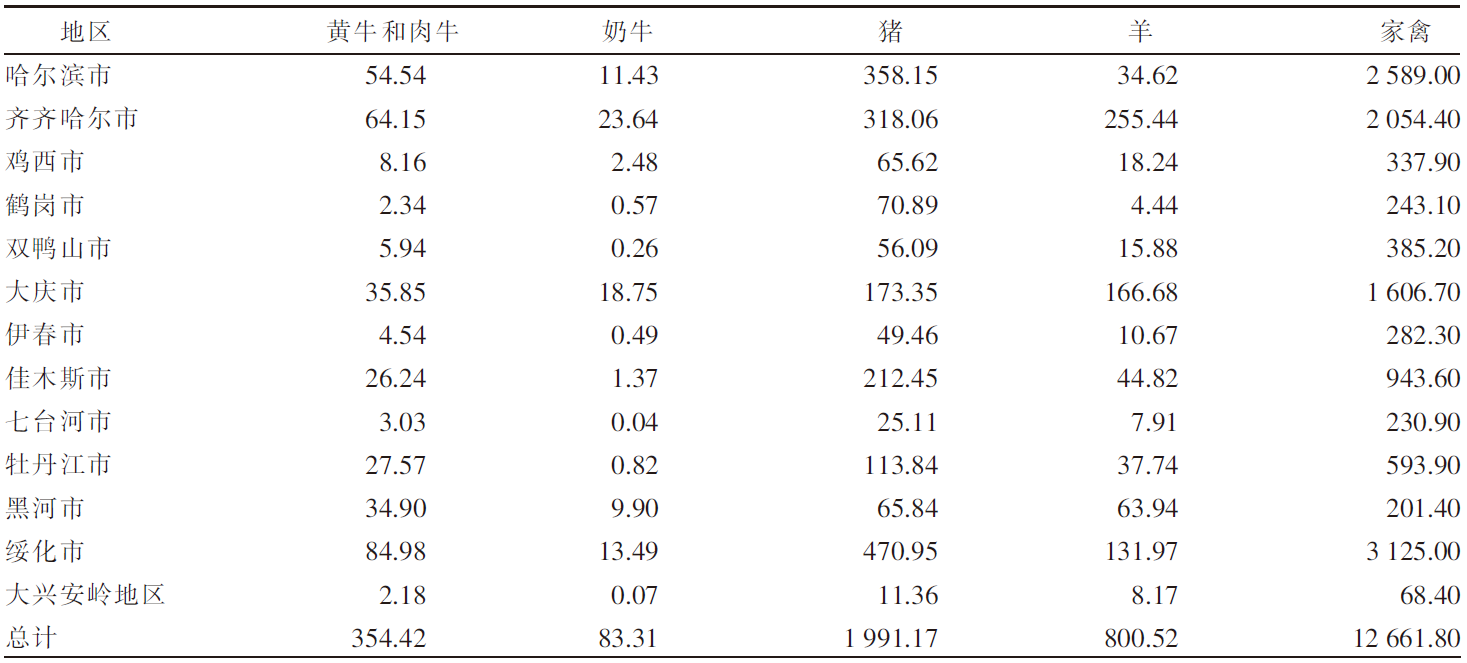
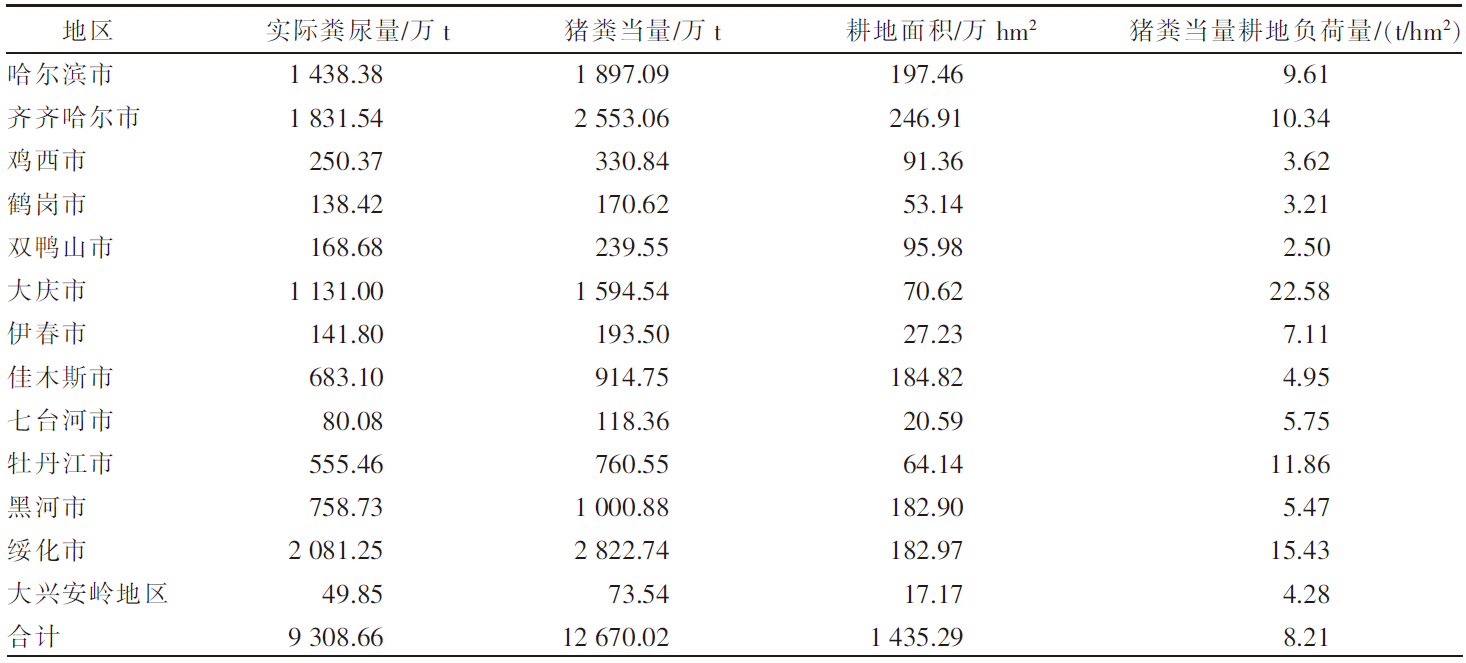
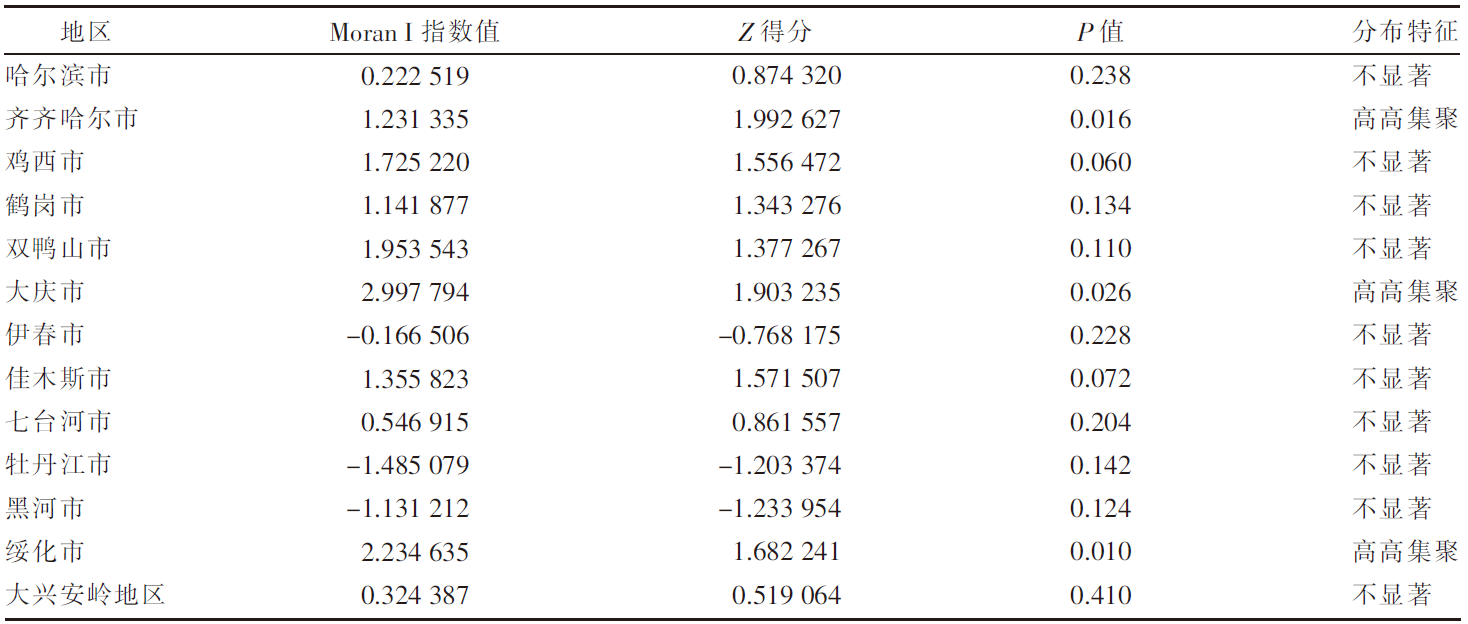
[目的]探究黑龙江省畜牧业粪污的时空分布及集聚特征。[方法]以《黑龙江省统计年鉴》为数据来源,利用畜禽粪污排放系数及计算模型,对黑龙江省2009—2020年畜牧业粪污[粪便、尿液以及粪污污染物生化需氧量(BOD)、化学需氧量(COD)、氨态氮(NH3-N)]排放量进行测算,运用Excel软件中的总体标准偏差函数和均值函数计算变异系数,评价该省畜禽粪尿总排放量的变化幅度。以2019年为例,对该省13个地区(绥化市、大庆市、哈尔滨市、齐齐哈尔市、牡丹江市、佳木斯市、双鸭山市、鸡西市、鹤岗市、黑河市、伊春市、七台河市、大兴安岭地区)的猪、羊、家禽、奶牛、黄牛和肉牛的饲养量进行调查分析;采用猪粪当量土地负荷量计算方法,对13个地区畜禽粪尿产生量及耕地负荷量进行分析;运用ArcGIS软件,采用空间自相关法对该省畜禽粪污量空间集聚特征进行分析。[结果]2009—2020年黑龙江省畜禽粪尿总排放量的变异系数为4.20%,表明畜禽粪尿总排放量有一定波动但年际变化幅度不大;粪尿总排放量由2009年的10 566.65万t下降到2020年的10 264.43万t,下降了2.86%;不同畜禽的粪尿排放量差异较大,黄牛和肉牛的粪尿排放量最多,家禽的最少;由于2020年畜牧业生产结构及规模的变动,畜禽粪污污染物BOD、COD、NH3-N排放量与2009年相比分别增加了3.67%、2.72%、2.31%。空间分布上,黑龙江省的畜牧业发展以绥化市、哈尔滨市和齐齐哈尔市为重点区域,主要养殖区域集中在该省西南地区,而东部、中部和北部地区的畜禽养殖量较少;该省13个地区的畜禽粪尿排泄量与畜禽粪尿猪粪当量排列顺序大致相同,绥化市、哈尔滨市、齐齐哈尔市是排名前三的地区;该省猪粪当量耕地负荷量平均值为8.21 t/hm2,大庆市猪粪当量耕地负荷量在13个地区中最高,为22.58 t/hm2,二者均低于我国土地最适宜负荷量;该省各地区的猪粪当量耕地负荷量呈现一定的集聚性,其中,大庆市、绥化市和齐齐哈尔市呈现出高高集聚的分布特征。[结论]黑龙江省畜禽生产和粪污排放的空间分布不平衡,但畜禽粪污的耕地负荷并未对环境产生不利影响。随着黑龙江省畜牧业的快速发展以及畜牧生产布局的动态变化,畜禽养殖污染问题也应引起更多关注。

关键词: 黑龙江省, 畜牧业, 粪污量, 时空分布, 集聚特征

Abstract:

[Objective] The aim of the present study was to investigate the temporal and spatial distribution and aggregation characteristics of livestock and poultry manures in Heilongjiang Province. [Method] Using the Statistical Yearbook of Heilongjiang Province as the data source, the coefficient and calculation model of livestock and poultry manure emissions were applied to evaluate the emission amount of livestock and poultry manures [feces, urine, and biochemical oxygen demand (BOD), chemical oxygen demand (COD) and ammonia nitrogen (NH3-N) of manure pollutants] in Heilongjiang Province from the year of 2009 to 2020. The changing range of the total emissions of feces and urine from livestock and poultry was assessed by calculation of the coefficient of variation using the overall standard deviation function and the mean value function in Excel software. Taking the year of 2019 as an example, investigation was conducted to analyze the breeding amount of pigs, sheep, poultry, dairy cows, yellow cattle and beef cattle in 13 regions of Heilongjiang Province (Suihua City, Daqing City, Harbin City, Qiqihar City, Mudanjiang City, Jiamusi City, Shuangyashan City, Jixi City, Hegang City, Heihe City, Yichun City, Qitaihe City and Daxing′anling Region). Using the calculation method of pig manure equivalent land load, the livestock and poultry manure production and the load of cultivated land in the 13 regions were analyzed. The spatial aggregation of livestock and poultry feces and urine pollution were characterized by the spatial autocorrelation method with ArcGIS software. [Result] From the year of 2009 to 2020, the coefficient of variation of the total emissions of feces and urine from livestock and poultry in Heilongjiang Province was 4.20%, indicating that there was some fluctuations in the total emissions, but the interannual variation range was small. The total emissions of feces and urine from livestock and poultry decreased by 2.86%, from 105.666 5 million tons in the year of 2009 to 102.644 3 million tons in the year of 2020. The feces and urine emissions from different livestock and poultry varied greatly, with yellow cattle and beef cattle having the highest emissions and poultry having the lowest. Due to the changes in the production structure and scale of animal husbandry in the year of 2020, the emissions of BOD, COD and NH3-N of livestock and poultry manure pollutants increased by 3.67%, 2.72% and 2.31% compared to those in the year of 2009, respectively. In terms of spatial distribution, Suihua City, Harbin City and Qiqihar City were the key areas for the development of animal husbandry in Heilongjiang Province. The main breeding regions were centered in the southwest part of this province, while the eastern, central and northern regions had relatively small breeding amount of livestock and poultry. The order of livestock and poultry feces and urine emissions and pig manure equivalent of livestock and poultry feces and urine in the 13 regions of this province was roughly the same, with Suihua City, Harbin City and Qiqihar City being the top three. The average value of pig manure equivalent cultivated land load was 8.21 t/hm2, while Daqing City had the highest land load among the 13 regions, coming in at 22.58 t/hm2, both of which were below the optimal land load in China. There was some degree of aggregation in the pig manure equivalent cultivated land load across different regions of this province, with Daqing City, Suihua City and Qiqihar City showing high-high aggregation characteristics. [Conclusion] Although there is an imbalance in the spatial distribution of livestock and poultry production and manure emissions in Heilongjiang Province, the environmental impacts of livestock and poultry manure pollution on cultivated land have not been negative. With the rapid development of animal husbandry and the dynamic changes in the layout of animal husbandry production in Heilongjiang Province, the problems of livestock and poultry pollution should garner more attention.

Key words: Heilongjiang Province, animal husbandry, manure amount, temporal and spatial distribution, aggregation characteristics

中图分类号: